
You've set up your wallet. You understand how lending protocols work. You know what liquidity pools are. But then you open a token chart — green and red candles, moving averages, volume bars, RSI indicators — and it looks like a foreign language.
You're not alone. Crypto charts intimidate most beginners. But reading a chart is a learnable skill, and once you understand the basics, you'll have a completely different relationship with the tokens you hold and the markets you participate in.
This guide covers everything you need to read a crypto chart with confidence — from candlesticks to support and resistance, to the indicators that actually matter for DeFi token analysis.
Before reading charts, you need to know where to find them.
TradingView is the most widely used charting platform in crypto. It supports every major token, offers dozens of technical indicators, and has a clean interface that works for beginners and professionals alike. Go to tradingview.com and search any token by name or ticker.
DexScreener is specifically built for DeFi tokens — it pulls price data directly from decentralized exchanges and shows real-time charts for tokens that aren’t listed on centralized platforms. If you’re researching a newer DeFi token, DexScreener is often your best source.
CoinGecko and CoinMarketCap offer basic charts alongside fundamental data like market cap, trading volume, and circulating supply — useful for a quick overview without diving into full technical analysis.
For this guide, we’ll focus on the concepts that apply across all of these platforms.
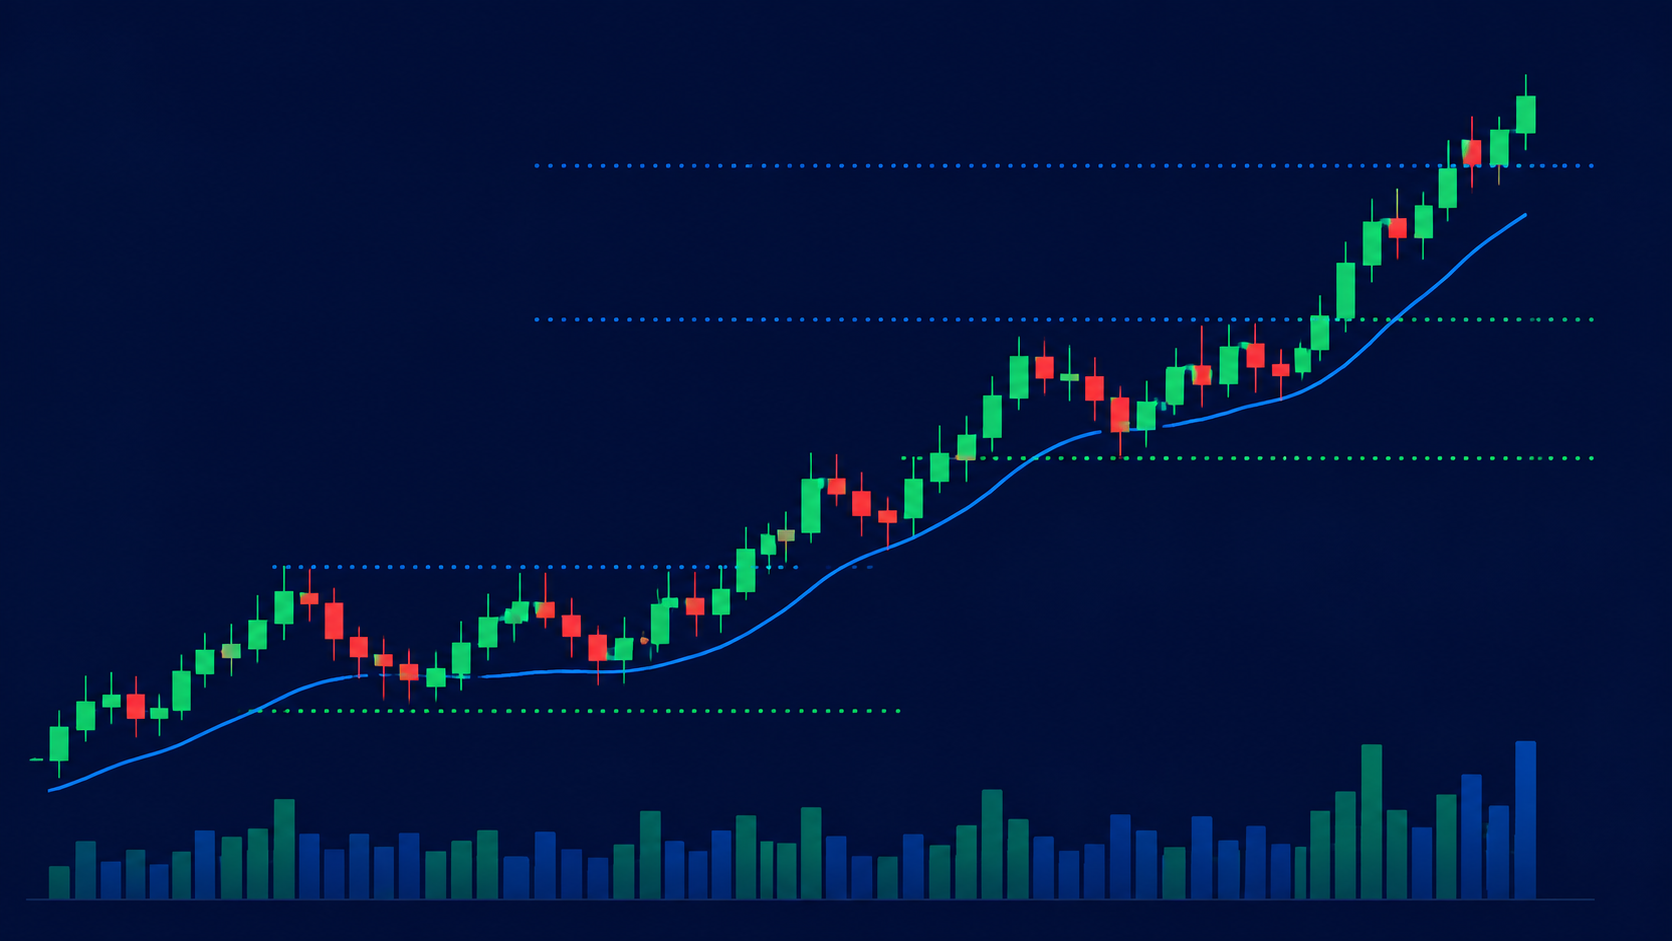
Every crypto chart is built from candlesticks — individual data points that show four pieces of information about price movement over a specific time period.
Each candlestick has:
Open — the price at the start of the time period
Close — the price at the end of the time period
High — the highest price reached during the period
Low — the lowest price reached during the period
The thick body of the candle represents the distance between open and close. The thin lines extending above and below — called wicks or shadows — represent the high and low.
Color tells you direction:
The timeframe determines what each candle represents. On a 1-hour chart, each candle shows one hour of price action. On a daily chart, each candle shows one full day. For DeFi analysis, the 4-hour and daily charts are the most useful starting points — they filter out short-term noise while still showing meaningful price structure.
If you learn nothing else from this guide, learn support and resistance — because these two concepts explain the majority of how price moves at key levels.
Support is a price level where buying pressure has historically been strong enough to stop price from falling further. Think of it as a floor. Every time price approaches that level, buyers step in and push it back up.
Resistance is the opposite — a price level where selling pressure has historically been strong enough to stop price from rising further. Think of it as a ceiling. Every time price approaches that level, sellers step in and push it back down.
Here’s what makes these levels useful in practice: once a resistance level is broken through and price closes above it, that level often flips — it becomes support. The ceiling becomes a floor. This flip is one of the most reliable patterns in all of technical analysis and appears constantly across crypto charts.
To identify support and resistance levels on any chart:
The more times a level has held, the more significant it is. A support level that has been tested and held four times carries more weight than one that has held once.
Beyond individual levels, price moves in trends — sustained directional movements that persist over time. Identifying the trend is the single most important context for any trade or investment decision.
An uptrend is characterized by a series of higher highs and higher lows. Each rally reaches a higher peak than the last, and each pullback finds support at a higher level than the previous pullback. Price is making progress upward.
A downtrend is the opposite — lower highs and lower lows. Each rally fails at a lower level than the last, and each decline reaches a new low. Price is making progress downward.
A sideways trend (also called consolidation or ranging) is when price moves within a defined range — bouncing between support and resistance without making meaningful progress in either direction. This often happens before a significant move and can be a period of accumulation or distribution.
Draw trend lines by connecting two or more significant lows in an uptrend (or two or more significant highs in a downtrend). The line shows the angle of the trend and can act as dynamic support or resistance as price moves along it.
The practical rule: trade in the direction of the trend. A token in a clear uptrend is statistically more likely to continue higher than to reverse. A token in a downtrend is statistically more likely to continue lower than to recover. Fighting the trend is how most beginners lose money on trades that seemed logical in isolation.
Price alone doesn’t tell the full story. Volume — the total amount of a token traded during a given period — tells you how much conviction sits behind a price move.
High volume on an upward move means many participants are buying — the move has real conviction behind it. High volume on a downward move means strong selling pressure. Low volume on any move means it lacks broad participation and is more likely to reverse.
The most important volume signals:
High volume breakout — price breaks through a key resistance level on significantly above-average volume. This is one of the strongest signals in technical analysis. The breakout has conviction and is more likely to hold than a low-volume break.
Low volume rally — price rises but volume is declining. This suggests the move lacks broad buying participation and is more susceptible to reversal. Be cautious.
Volume spike on reversal — price has been falling and then reverses on a sudden volume spike. This can signal exhaustion of selling pressure and a potential bottom — particularly if the price closes near its high for that candle.
On DexScreener and TradingView, volume is displayed as a histogram at the bottom of the chart. Make it a habit to check volume whenever you’re evaluating a price move — it will save you from misreading low-conviction moves as significant signals.
Technical indicators are mathematical calculations applied to price and volume data to help identify trends, momentum, and potential reversals. There are hundreds of them — most are redundant. Here are the two that provide the most value for DeFi token analysis with the least complexity.
Moving Averages
A moving average smooths out price data by calculating the average price over a defined number of periods — reducing noise and making the underlying trend easier to see.
The two most widely used are the 50-period moving average (medium-term trend) and the 200-period moving average (long-term trend). When price is above both moving averages, the token is in a healthy uptrend. When price is below both, it’s in a downtrend. When the 50-period crosses above the 200-period — called a golden cross — it’s considered a bullish signal. When it crosses below — a death cross — it’s bearish.
Moving averages also act as dynamic support and resistance. In strong uptrends, price frequently bounces off the 50-period moving average during pullbacks before continuing higher.
RSI (Relative Strength Index)
RSI measures the speed and magnitude of recent price changes on a scale of 0 to 100. It answers the question: has this token moved too far, too fast?
RSI is most useful as a confirmation tool rather than a standalone signal. A token breaking above resistance with RSI not yet overbought has more room to run than one breaking out with RSI already at 85. An oversold reading during a broader uptrend can identify strong buying opportunities.
When you open any crypto chart, work through these steps in order:
Step 1 — Identify the trend. Is price making higher highs and higher lows (uptrend), lower highs and lower lows (downtrend), or moving sideways? This is your context for everything else.
Step 2 — Find key levels. Where has price reversed before? Mark the significant support and resistance levels on your chart. These are the price areas that matter most.
Step 3 — Check volume. Is current volume above or below average? Does it confirm the price action you’re seeing?
Step 4 — Add moving averages. Is price above or below the 50 and 200 period moving averages? Are the averages sloping up or down?
Step 5 — Check RSI. Is the token overbought, oversold, or neutral? Does this confirm or contradict what the price action is suggesting?
Step 6 — Make a decision. Based on trend, key levels, volume, and indicators — does the chart support the thesis you had before opening it, or does it raise concerns worth addressing?
This framework won’t predict the future. Nothing in technical analysis predicts with certainty. What it does is give you a structured, repeatable way to evaluate price information rather than reacting to random noise.
Chart analysis is a tool — not a guarantee. Crypto markets are volatile, sentiment-driven, and influenced by factors no chart can capture: regulatory announcements, protocol exploits, macroeconomic shifts, and simple market irrationality.
The most successful DeFi participants use charts as one input among several — alongside fundamental analysis of the protocol, understanding of the team and tokenomics, and awareness of broader market conditions. A token with strong fundamentals, a healthy chart, and positive market sentiment is a much stronger thesis than any single factor alone.
Use charts to time entries and manage risk. Don’t use them as the sole basis for significant financial decisions.
Reading a crypto chart is a skill that compounds over time. The first few charts feel overwhelming. After fifty, patterns start becoming obvious. After a hundred, you’ll find yourself reading charts the way experienced DeFi users do — quickly, efficiently, and with a clear sense of what the market is telling you.
Start simple. Master candlesticks, support and resistance, and volume before adding any indicators. Open TradingView or DexScreener today and spend twenty minutes looking at the chart of a token you already hold — you’ll be surprised how much more you see after reading this guide.
Educational content only — not investment, financial, tax, or legal advice. Cryptocurrency and DeFi involve substantial risk, including the potential for total loss of capital. See our full Terms & Conditions and Privacy Policy.